- Home
- Market Reports
- The 17,998-home gap
Thematic report · 5 min read · Updated September 2026
The 17,998-home gap: new build and net housing additions in England
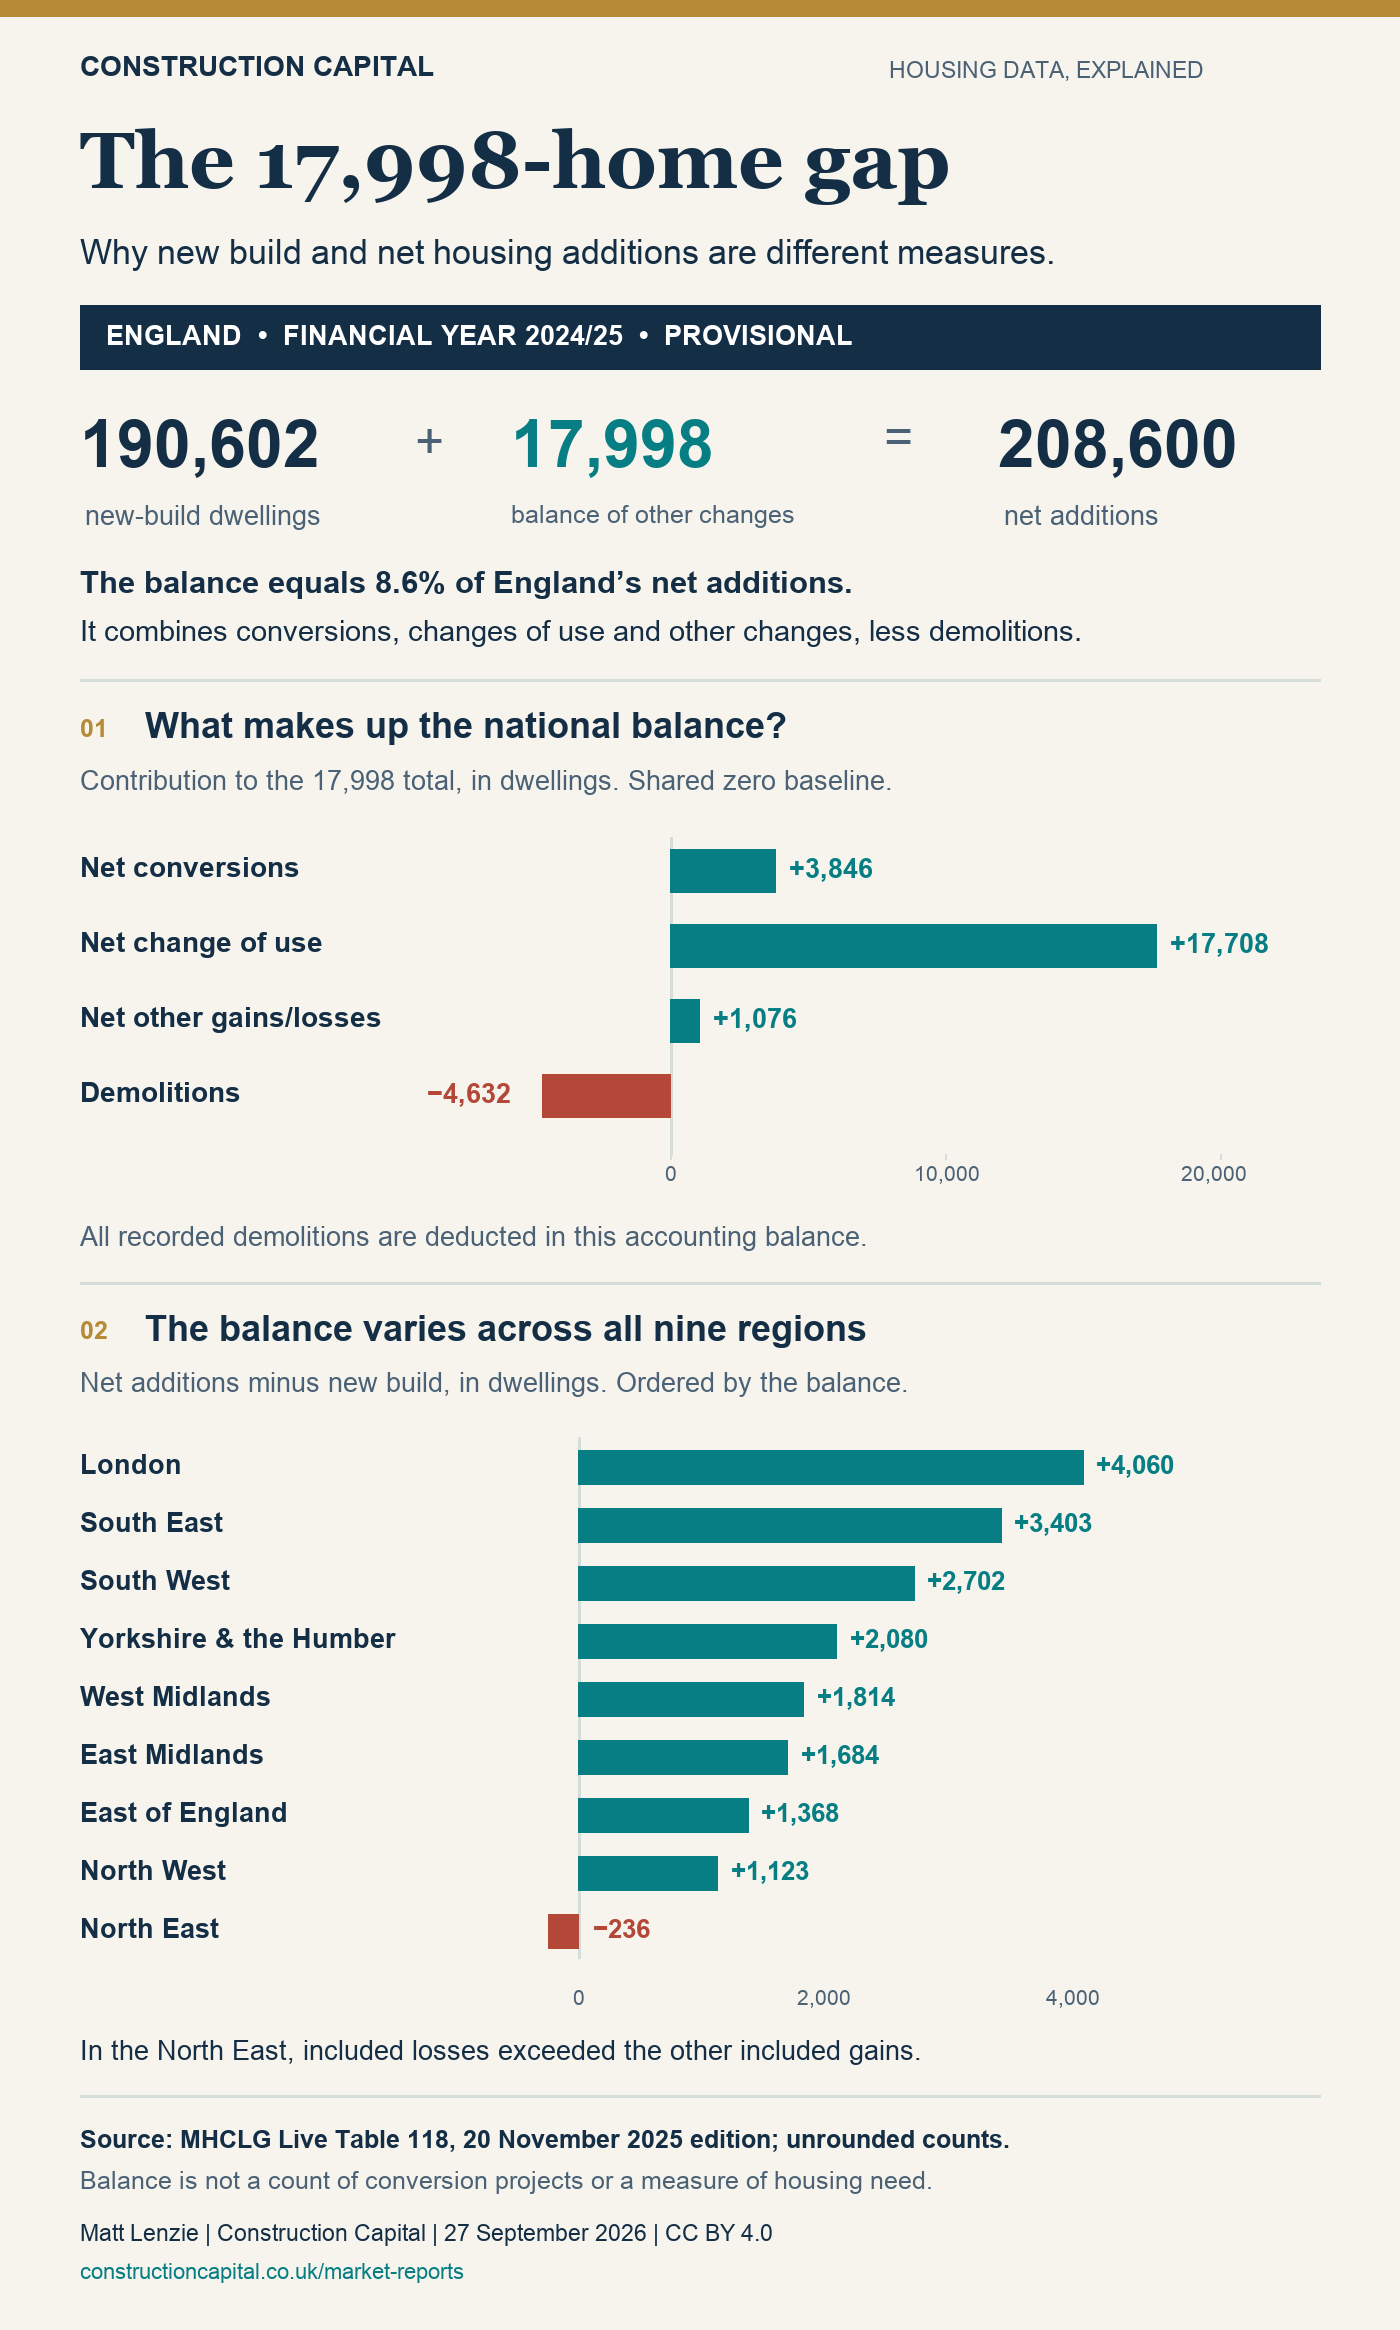
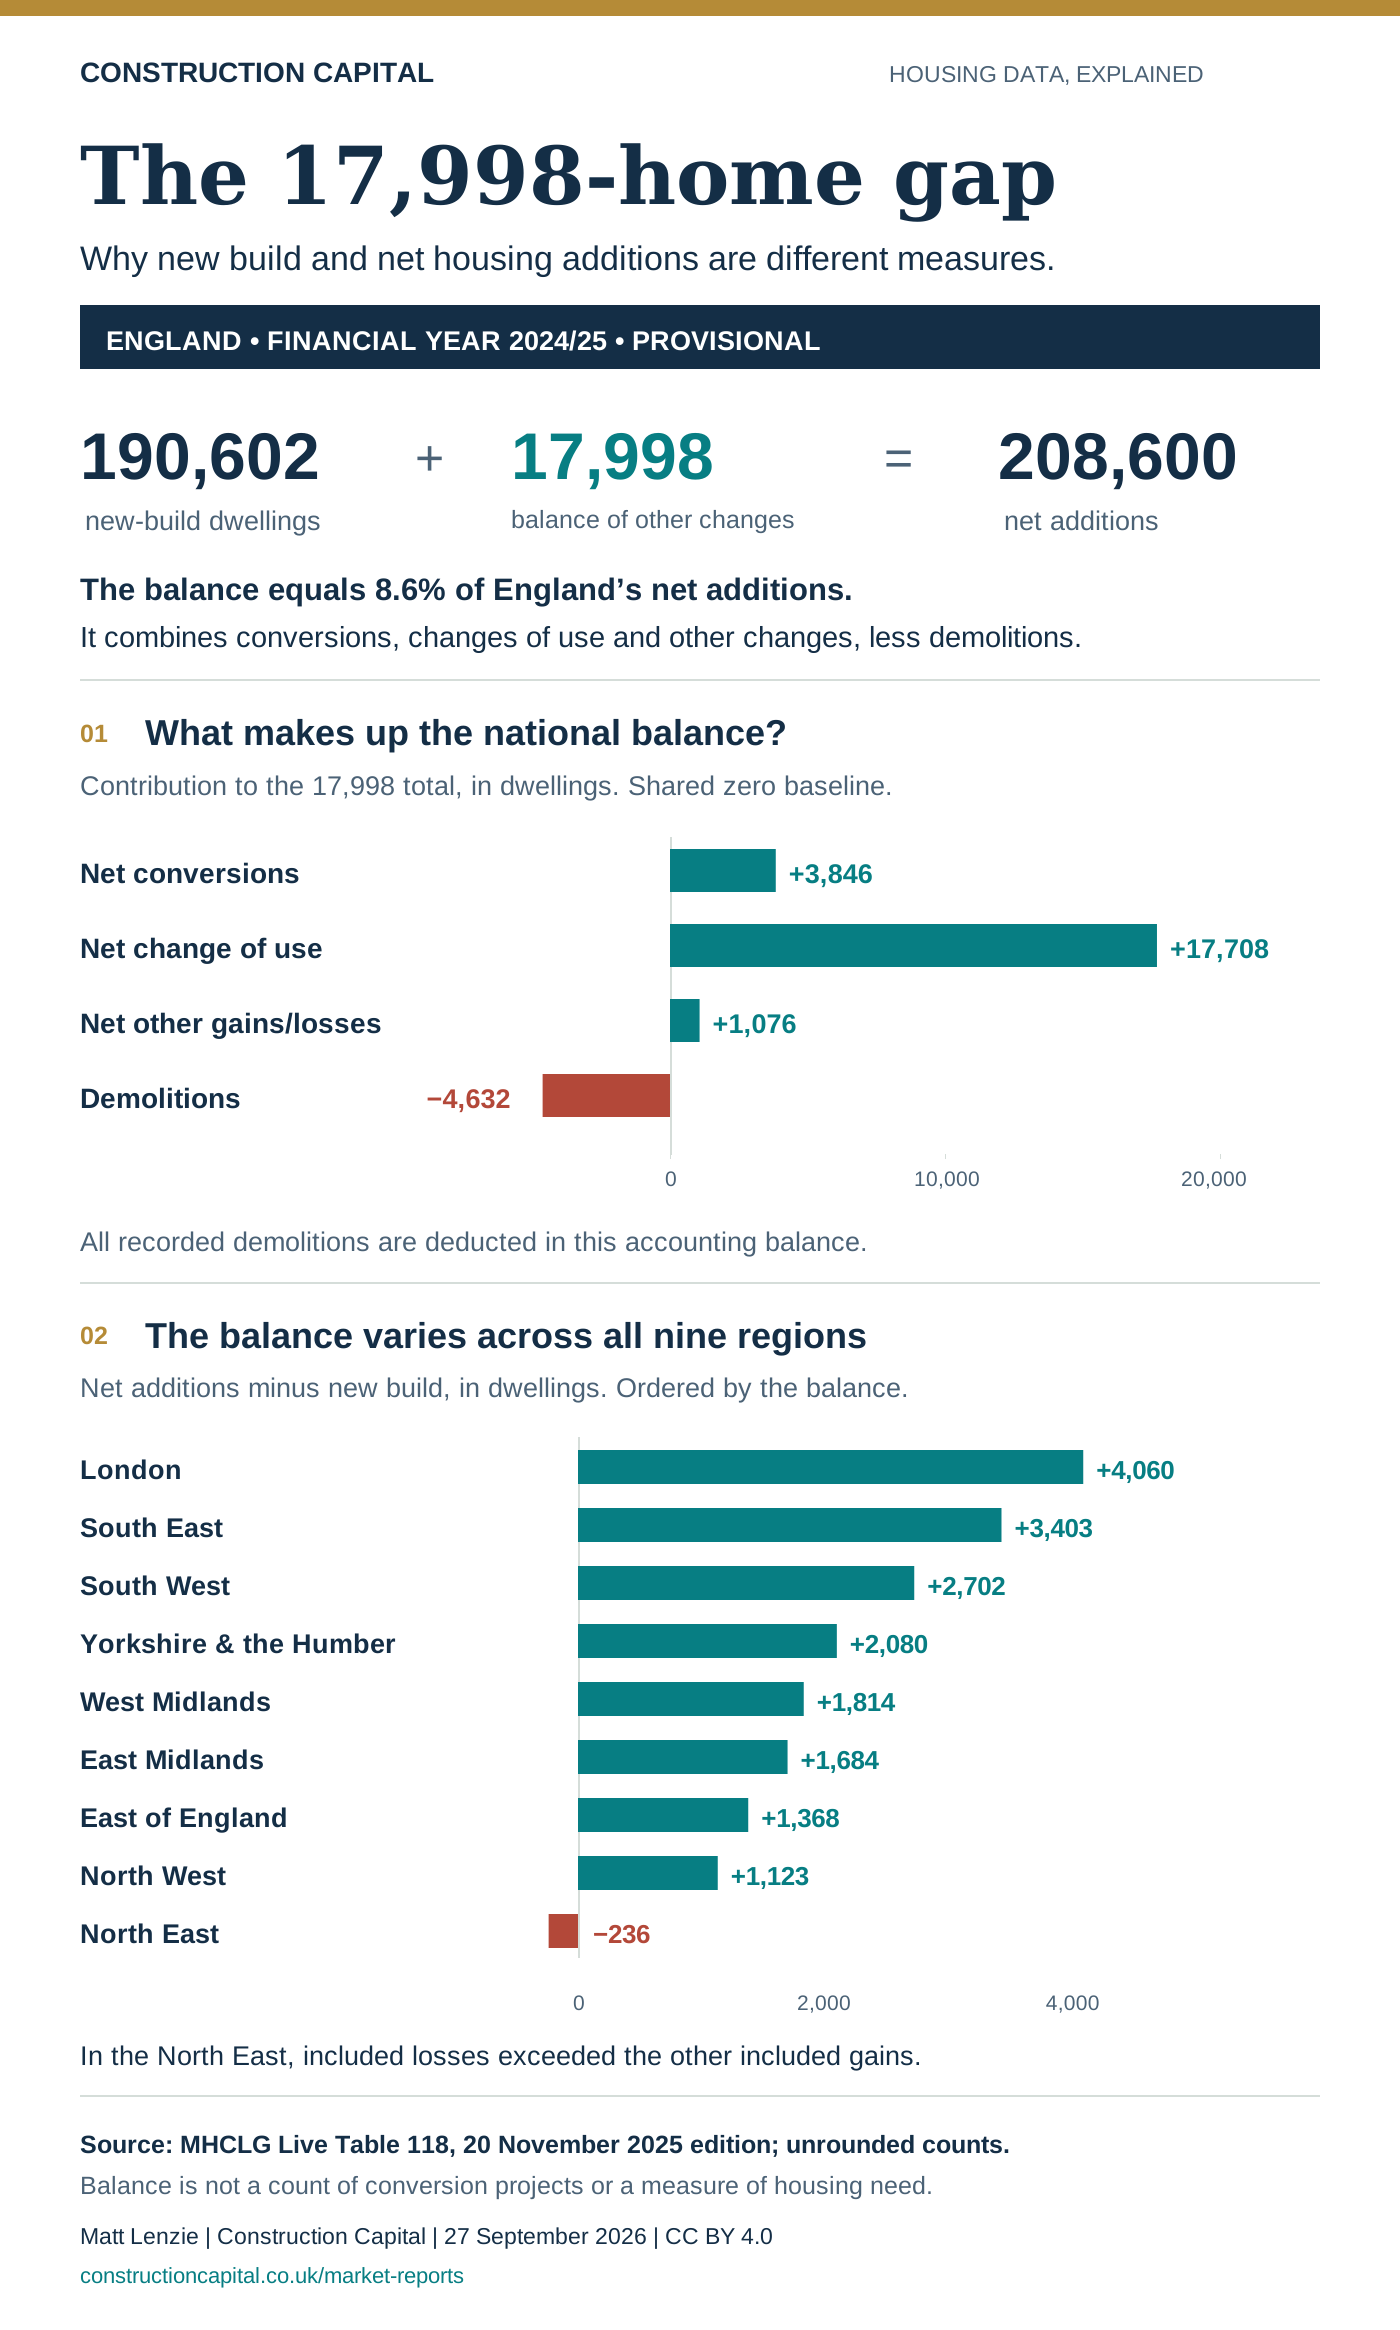
England recorded 190,602 new-build dwellings and 208,600 net additions in 2024/25. A national component chart and nine regional comparisons explain the difference.
01
Two housing measures, one explainable difference
England recorded 190,602 new-build dwellings in 2024/25, while net additional dwellings totalled 208,600. The 17,998-dwelling difference represents the combined balance of conversions, changes of use, other gains and losses, and demolitions. It is not a count of homes missing from the statistics.
The balance was equivalent to 8.6% of England’s net additions: 17,998 divided by 208,600, multiplied by 100. New build supplied the other 91.4% in this accounting comparison. This denominator is net additions, not the existing housing stock or the number of planning permissions.
These figures cover the financial year from April 2024 to March 2025. They use the unrounded observations in the 20 November 2025 edition of MHCLG Live Table 118. The latest year is provisional; later releases may revise it.
02
The national arithmetic
The official identity is: new build + net conversions + net change of use + net other gains and losses − demolitions = net additions. In this release, that is 190,602 + 3,846 + 17,708 + 1,076 − 4,632 = 208,600.
| Component | Signed contribution, dwellings |
|---|---|
| Net conversions | +3,846 |
| Net change of use | +17,708 |
| Net other gains and losses | +1,076 |
| Demolitions | -4,632 |
| Balance | +17,998 |
Net change of use was the largest positive component outside new build, at 17,708 dwellings. Conversions contributed 3,846 and other gains and losses another 1,076. Demolitions reduced the combined total by 4,632.
The infographic uses a common zero baseline within each chart. Positive components appear to the right and demolitions to the left. The signed labels retain the exact published counts, so small components remain visible without exaggerating their size.
03
All nine regions, including a negative balance
London had the largest balance by count, at 4,060 dwellings, followed by the South East at 3,403. The South West had the largest balance relative to its net additions, at 12.8%, slightly above London’s 12.4%. Counts and shares therefore give different orderings.
| Region | New build | Net additions | Balance | Balance as share of net additions |
|---|---|---|---|---|
| North East | 8,573 | 8,337 | -236 | -2.8% |
| North West | 24,072 | 25,195 | +1,123 | 4.5% |
| Yorkshire and the Humber | 16,015 | 18,095 | +2,080 | 11.5% |
| East Midlands | 19,930 | 21,614 | +1,684 | 7.8% |
| West Midlands | 18,919 | 20,733 | +1,814 | 8.7% |
| East of England | 24,644 | 26,012 | +1,368 | 5.3% |
| London | 28,618 | 32,678 | +4,060 | 12.4% |
| South East | 31,469 | 34,872 | +3,403 | 9.8% |
| South West | 18,362 | 21,064 | +2,702 | 12.8% |
| England | 190,602 | 208,600 | +17,998 | 8.6% |
The North East recorded 8,573 new-build dwellings but 8,337 net additions. Its balance was −236: the losses included in the calculation exceeded the other included gains. Net additions themselves were still positive. A negative balance does not mean the region’s housing stock fell overall.
The nine regional balances sum exactly to England’s 17,998 in this release. The comparison describes the composition of supply. It does not rank regions against housing need, population, existing stock or development quality.
04
What the balance can and cannot tell us
Subtracting new build from net additions includes every demolition in the published identity. It is therefore not a direct count of adaptive-reuse projects, conversion schemes or gross homes created inside existing buildings. A dwelling count also differs from a project count.
The data identify accounting components rather than economic causes. They cannot establish why a particular region has a larger balance, whether the developments were financially viable or what any individual site could deliver.
Construction Capital’s Beyond new build report uses the same source to examine the year-on-year change in supply. Our regional housing-share explainer shows why a rising national share can accompany fewer additions. These are related analyses, not independent datasets or third-party endorsements.
05
Backing data and reproducible methods
The original source is MHCLG Live Table 118, worksheet LT118_unrounded. Read the 2024/25 statistical release for the definitions and its rounded presentation. This analysis preserves unrounded counts and the fixed release vintage.
The parent study checks 120 source observations across two financial years, ten geographies and six components. All 33 checks pass: 20 component identities, 12 regional-to-England sums and one national change decomposition. The new graphic adds checks for its national balance, nine-region sum and displayed percentage.
Download the national component CSV, the regional table or the complete backing-data and graphic package. The package includes the retained source workbook, source-cell references, data dictionary, methods, validation outputs and reproduction code. The existing parent-data mirror remains available.
06
Author, reuse and corrections
Analysis and graphic: Matt Lenzie, Construction Capital, 27 September 2026. Construction Capital provides property-finance services. This historical statistical explanation does not assess the suitability of a finance product or individual development.
Download PNG or SVG. Original graphic and commentary are licensed under CC BY 4.0. Attribute Matt Lenzie / Construction Capital and retain the year, source and provisional-data note. The official statistics contain public-sector information licensed under the Open Government Licence v3.0.
Research item B001-R29-V01 is a visual adaptation of B001-R29. Version 1, first published 27 September 2026. No corrections at first publication. Methods and backing files are supplied so readers can check the findings.
More intelligence
Related
market reports.
Ready when you are
Ready to develop?
Tell us the deal.
We will source competitive terms from our panel of 100+ lenders and come back with an initial structure within one working day.