- Home
- Market Reports
- Fewer homes, a bigger share
Thematic report · 5 min read · Updated September 2026
Fewer homes, a bigger share: reading England’s housing supply figures
England’s net housing additions fell 5.8%. South East, London and East of England also added fewer homes, yet their combined share edged up. Here is why.
01
A small increase in share alongside a fall in output
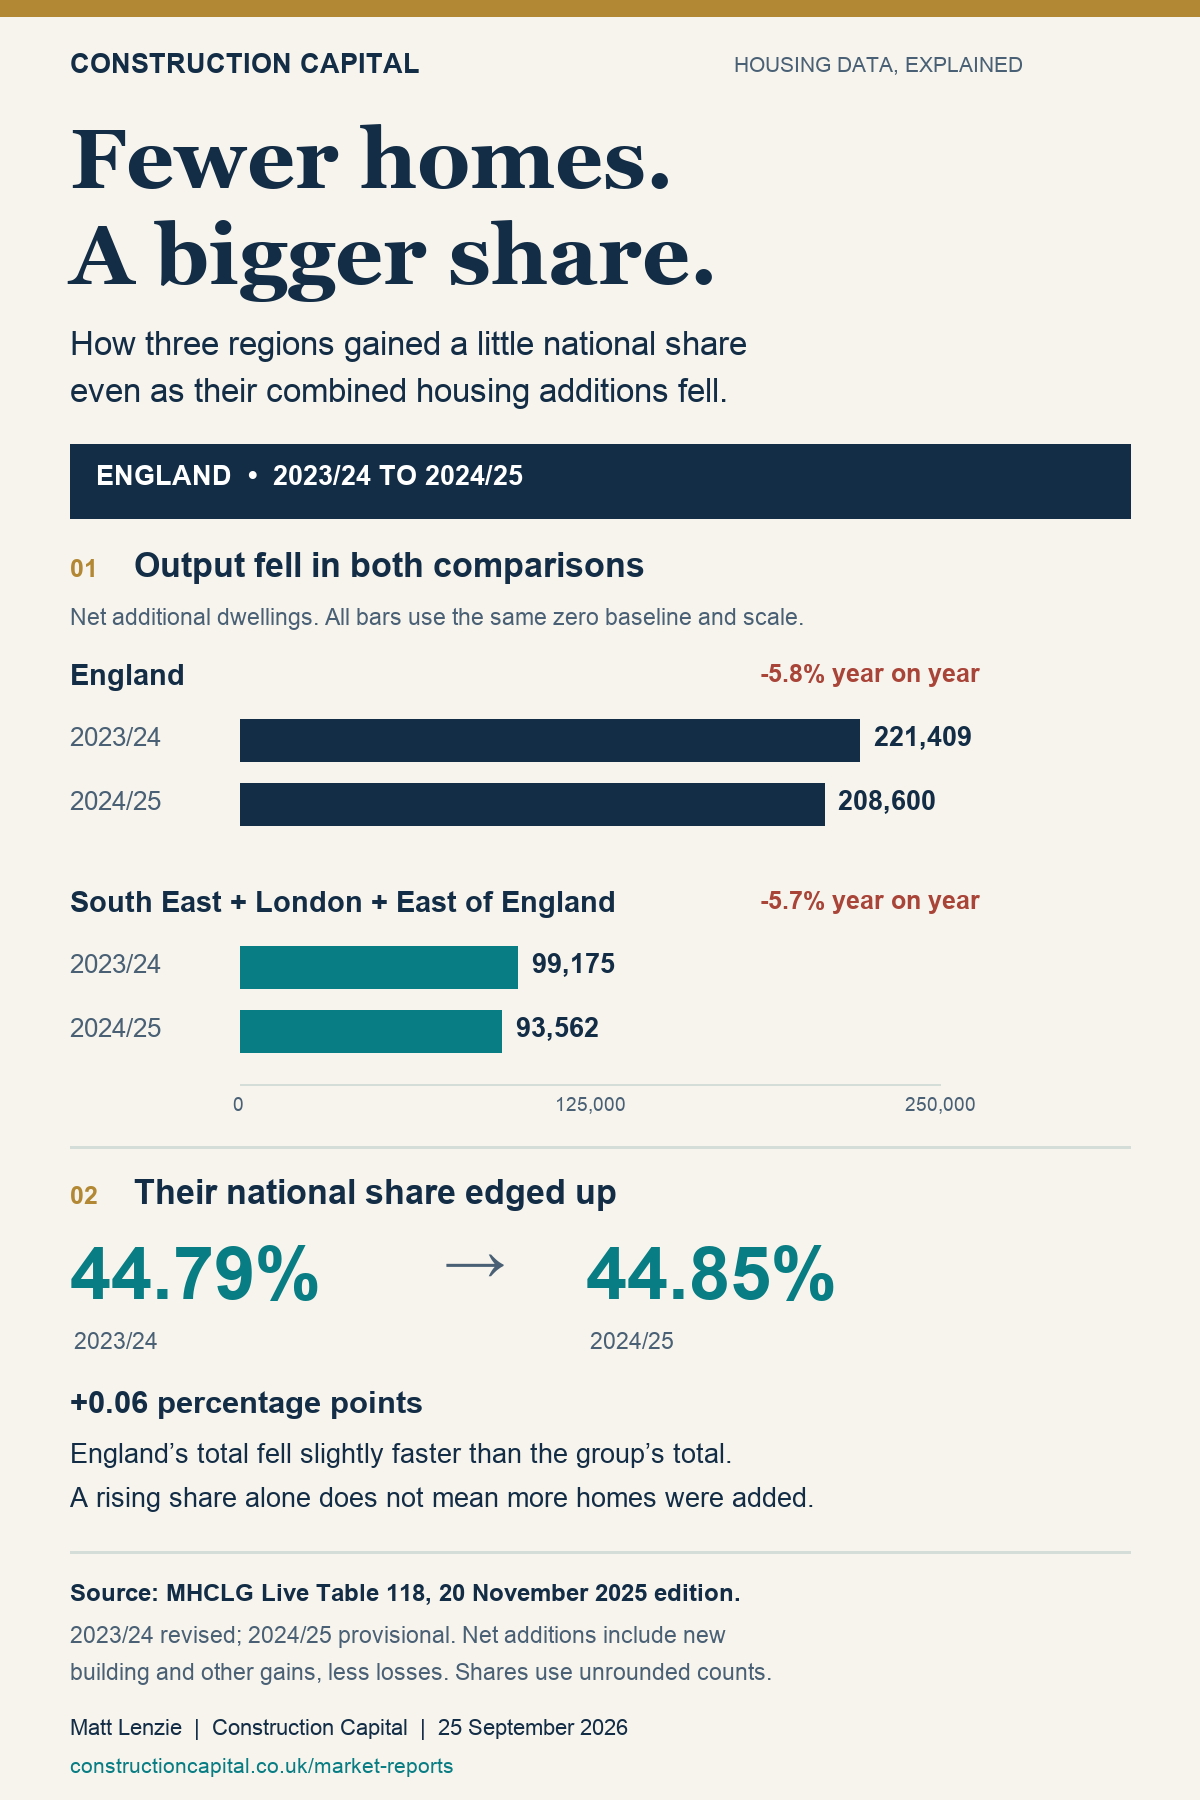
England recorded 208,600 net additional dwellings in 2024/25, compared with 221,409 in 2023/24. That was a fall of 12,809 dwellings, or 5.8%. Over the same period, the South East, London and East of England together went from 99,175 to 93,562 net additions, a fall of 5,613 dwellings, or 5.7%.
The group’s combined share of England’s additions nevertheless edged up from 44.79% to 44.85%. There is no contradiction: the national total, which is the denominator, fell slightly faster. The share increase was about 0.06 percentage points. It does not show that the group delivered more homes.
| Measure | 2023/24 (revised) | 2024/25 (provisional) | Change |
|---|---|---|---|
| England | 221,409 | 208,600 | -12,809 (-5.8%) |
| South East + London + East of England | 99,175 | 93,562 | -5,613 (-5.7%) |
| Group share of England | 44.79% | 44.85% | +0.06 percentage points |
These are financial-year comparisons of housing supply in England. They are not UK-wide figures, calendar-year statistics, sales transactions or planning approvals. The latest year is provisional and the previous year is revised in this release.
02
What a regional share actually measures
Share = the group’s net additional dwellings divided by England’s net additional dwellings, multiplied by 100. For 2023/24, 99,175 ÷ 221,409 × 100 = 44.7927%. For 2024/25, 93,562 ÷ 208,600 × 100 = 44.8523%. Subtracting the unrounded ratios gives an increase of 0.0597 percentage points.
Counts and shares answer different questions. The count describes how many dwellings were added on a net basis. The share describes how those additions were distributed across England. Read both before describing a region as gaining ground.
This comparison keeps the same three regions in both years: South East, London and East of England. It therefore avoids a change in group membership affecting the result. They were also the three largest contributors by count in both selected years.
03
The wider regional picture
The South East recorded 34,872 net additions in 2024/25, London 32,678 and the East of England 26,012. The remaining six regions together recorded 115,038, or 55.15% of England’s total. The national result therefore reflects changes both inside and outside the selected group.
| Region | Net additional dwellings | Share of England |
|---|---|---|
| South East | 34,872 | 16.7% |
| London | 32,678 | 15.7% |
| East of England | 26,012 | 12.5% |
| North West | 25,195 | 12.1% |
| East Midlands | 21,614 | 10.4% |
| South West | 21,064 | 10.1% |
| West Midlands | 20,733 | 9.9% |
| Yorkshire and the Humber | 18,095 | 8.7% |
| North East | 8,337 | 4.0% |
The displayed regional shares sum to 100.1% because they are rounded independently to one decimal place. Calculations use the published, unrounded counts and England total. Region size, existing dwelling stock and housing need differ, so this ordering is not a ranking of performance against need.
A separate regional delivery comparison examines additions relative to existing housing stock. It answers a different question from the count and share comparisons here.
04
Net additions are broader than new housebuilding
Net additional dwellings measure the change in housing supply from new building and other gains, less losses. Conversions, changes of use, other gains or losses and demolitions can all matter. A decrease in net additions cannot automatically be described as the same percentage decrease in new-build completions.
Our Beyond new build report examines the components of England’s 2024/25 supply change. This infographic adapts the national-share comparison in Where England adds homes. These publications are related analyses by Matt Lenzie for Construction Capital, with an overlapping official source.
05
Source, methods and downloadable backing data
Source: MHCLG live tables on housing supply: net additional dwellings, Table 118, worksheet LT118_unrounded, 20 November 2025 edition. The source workbook was retrieved on 16 September 2026 and retained unchanged. Read the 2024/25 statistical release and technical notes for definitions, coverage and revisions.
This infographic is research item B001-R30-V01, a visual adaptation of B001-R30. The backing archive preserves the original workbook, source-cell observations, six CSV tables, reproduction code and 26 validation checks. Regional sums match the England total in both years used here. Older years in the full archive retain the official one-dwelling reconciliation differences explained in its methods.
Download the four-row infographic CSV or download the full backing archive and graphic sources. The existing public backing-data mirror contains the parent study’s data and reproduction code.
This is descriptive historical analysis. It does not estimate housing need, explain the causes of the change or establish the viability of an individual development. Later statistical releases may revise these values.
06
Reuse the infographic
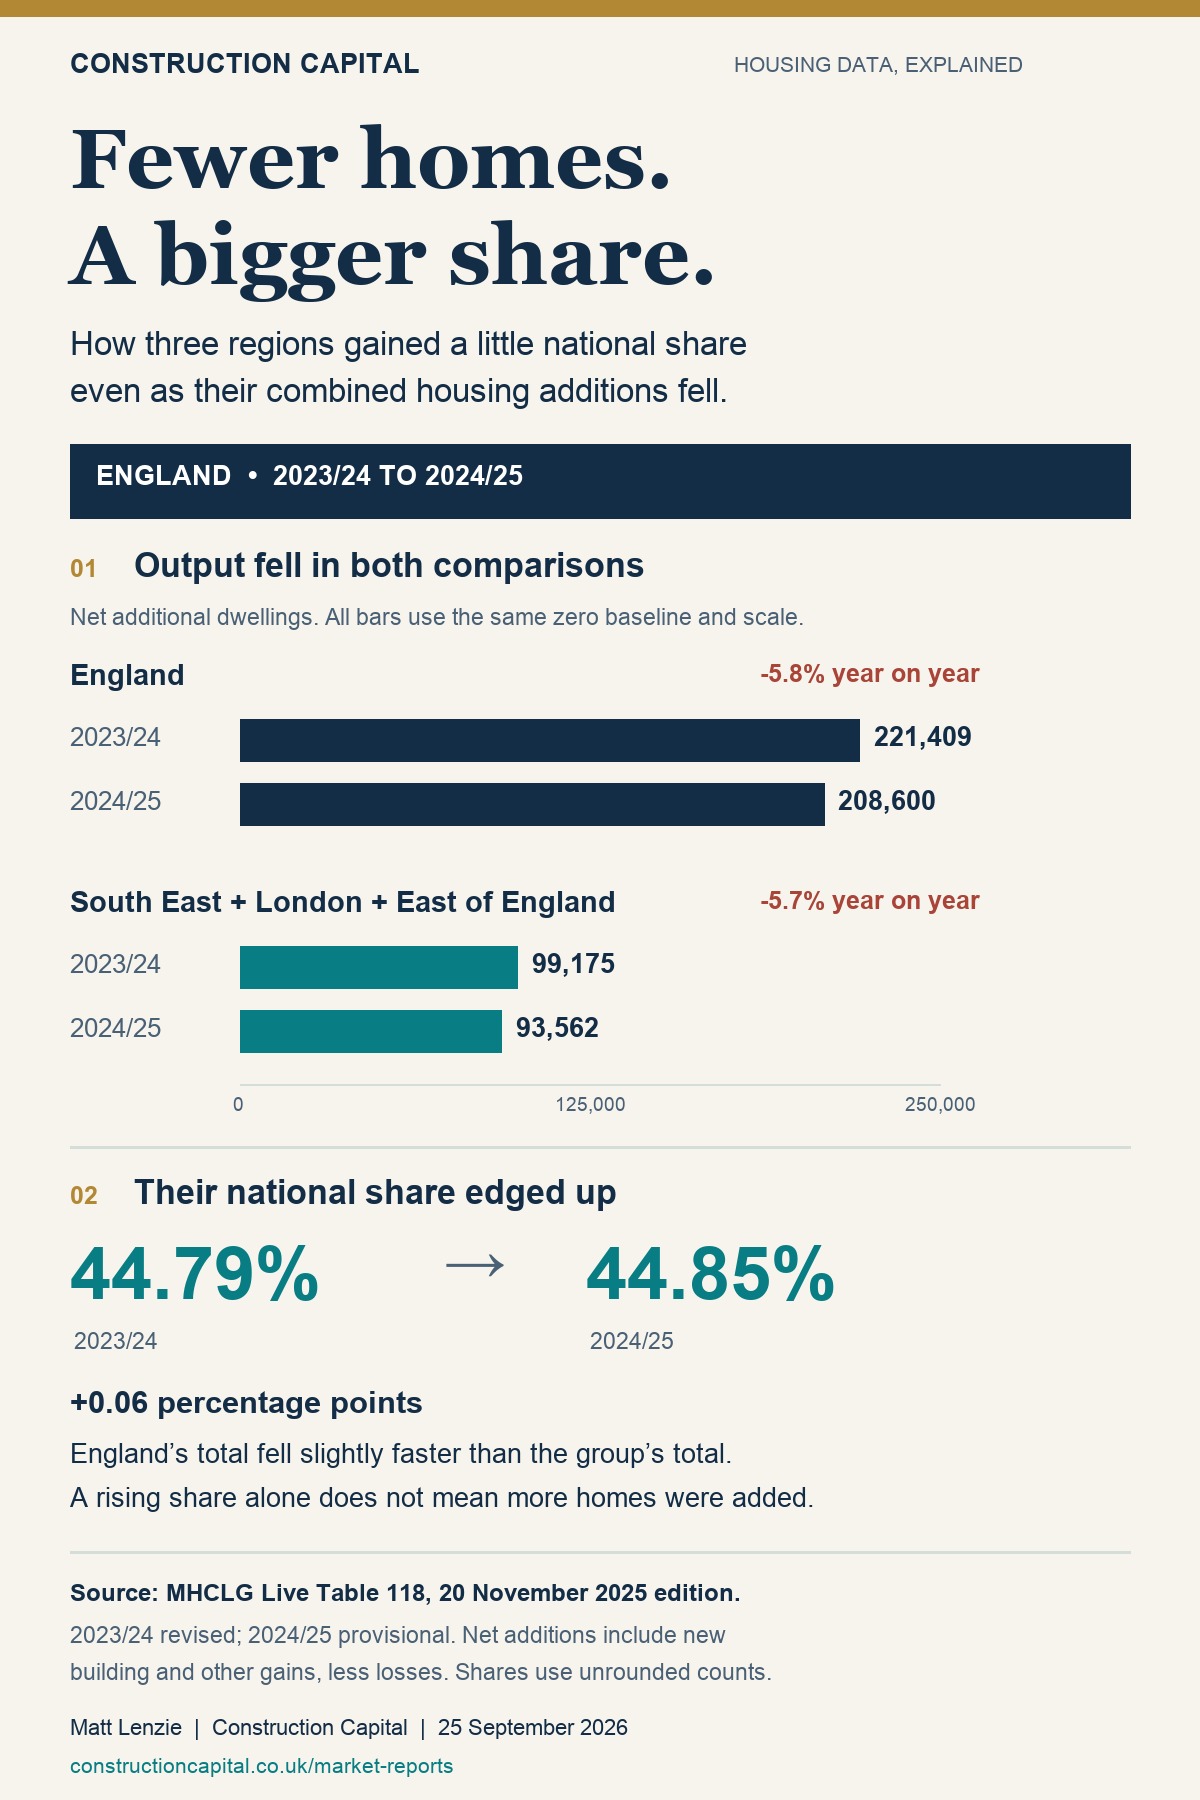
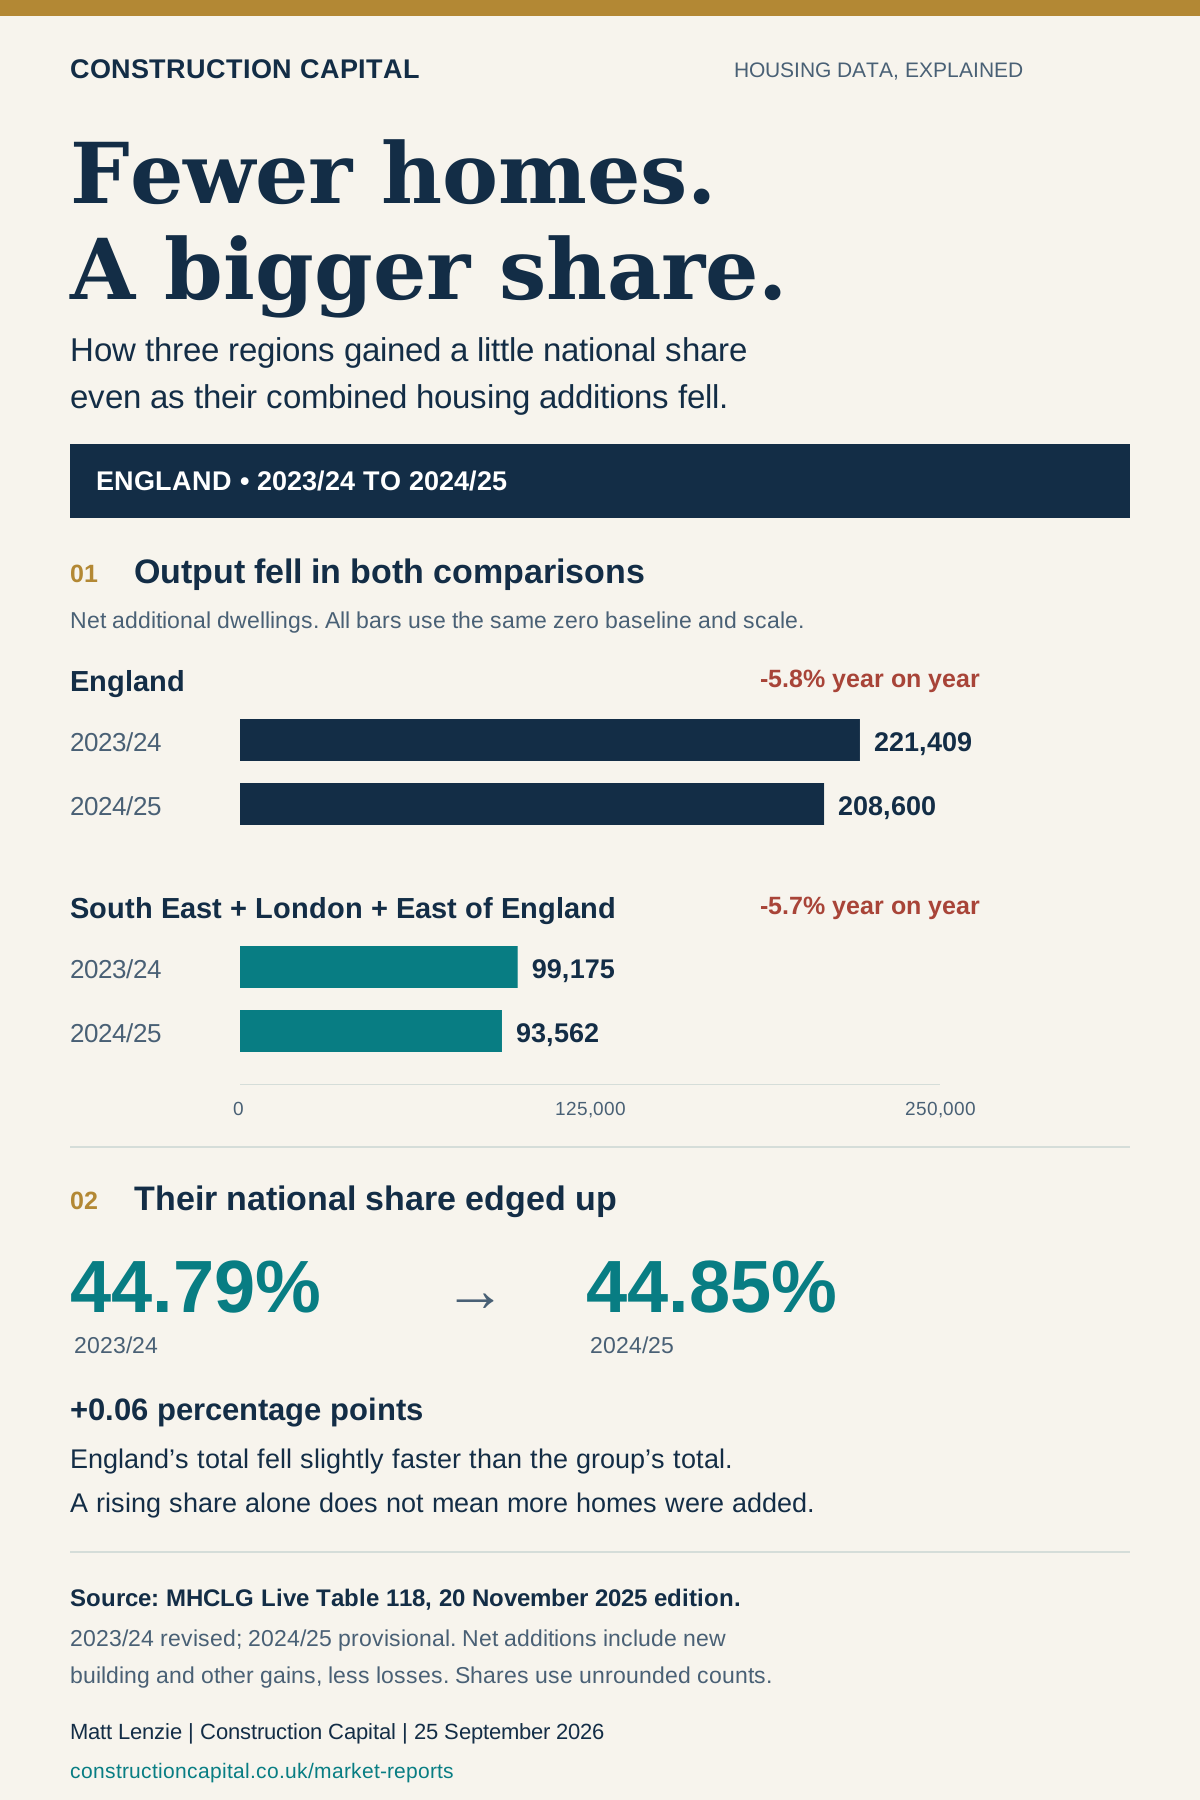
Download the infographic as PNG (1,200 × 1,800 pixels), JPEG or SVG. The figure and original commentary are available under Creative Commons Attribution 4.0. Attribute Matt Lenzie, Construction Capital, and link to this analysis when publishing online. Keep the financial years, definitions and provisional-data note with the figure.
The underlying official statistics contain public sector information licensed under the Open Government Licence v3.0. Reuse permission does not imply endorsement by MHCLG or Construction Capital.
Ready when you are
Ready to develop?
Tell us the deal.
We will source competitive terms from our panel of 100+ lenders and come back with an initial structure within one working day.